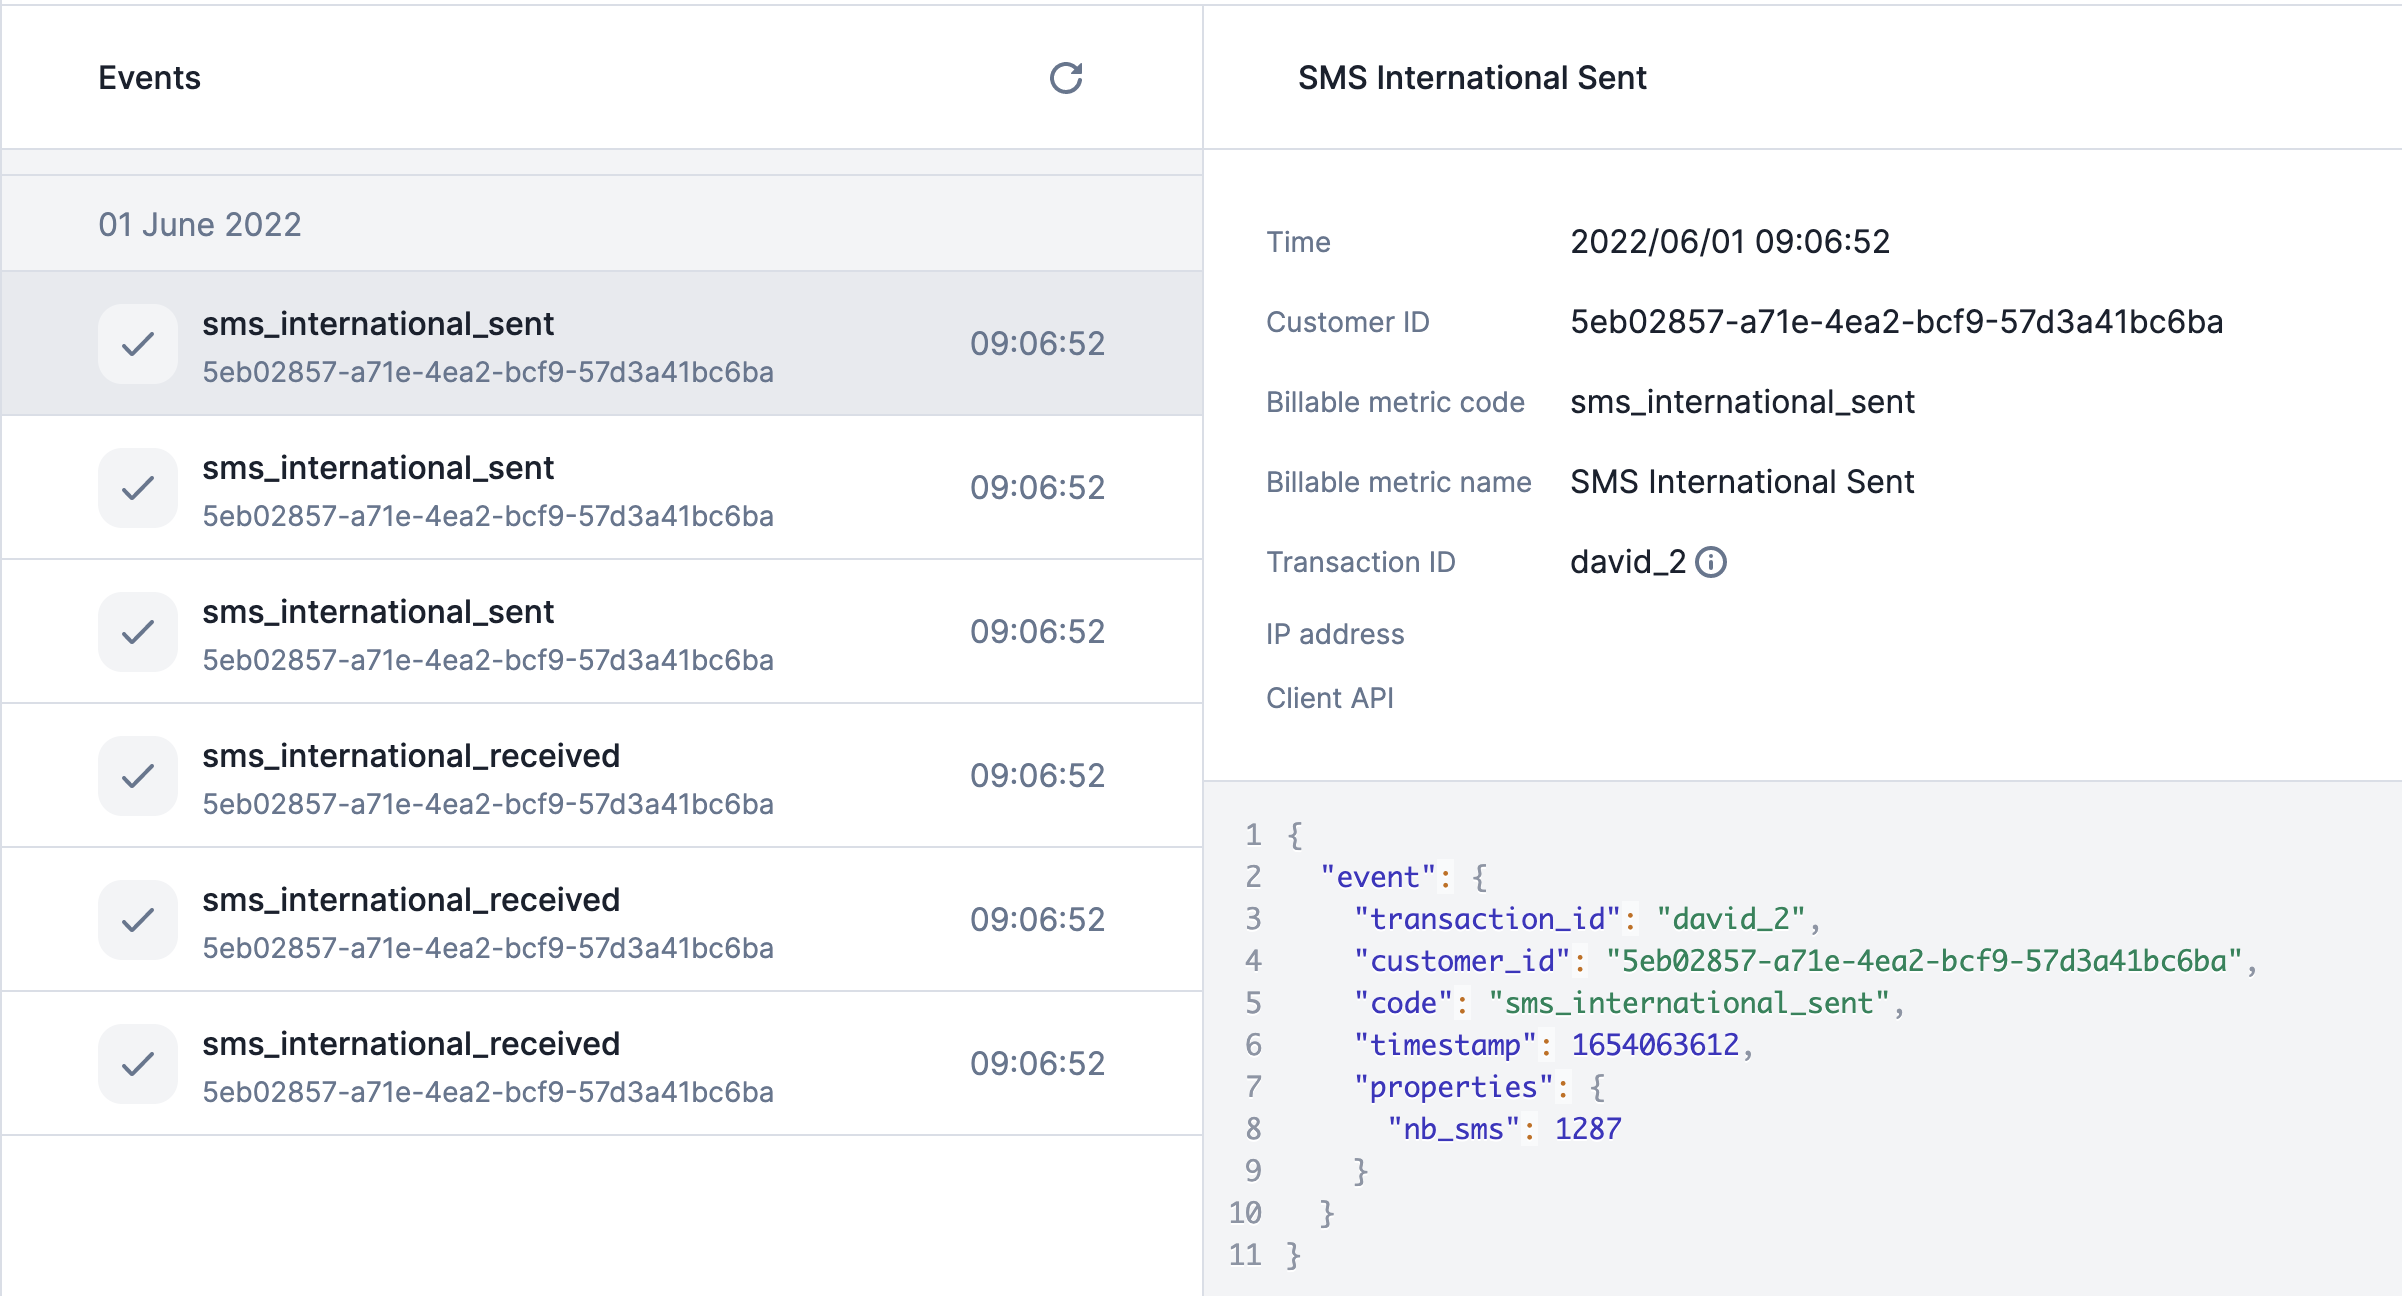
Accessing the events list
You can access the events list from the UI by following this path:
- Go to the Developers section in the sidebar;
- Click the events tab;
- See a list of ingested events; and
- Reload this list when you ingest new events.
By default, the UI shows you a list of the latest 20 events, but you can load
much more by scrolling down the page.
If an event is not shown in the UI, it has not been ingested.
Accessing a specific event
In the events list view, by clicking on a specific event, you will have access to 2 main
blocks:
- A list of useful properties returned
- Time: timestamp of the received events;
- Customer ID: the ID of your customer;
- Billable metric code: code of the billable metric linked to the event;
- Billable metric name: name of the billable metric linked to the event;
- Transaction ID: unique
transaction_id of the event used as
idempotency key;
- IP Address: IP address of the event sender; and
- Client API: Lago Client API used to send the event.
- A JSON with event’s arguments sent in the payload
Possible warnings
Some events can be ingested but trigger a bad or unexpected behavior. This is
why Lago displays in the UI two possible warnings:
- The event
code is not related to an existing billable metric; and
- The billable metric’s property used for the aggregation is not sent
through this event.
